
Why the environment deteriorates in fast growing countries as they grow.

The 2019 reports from Delhi that the instruments lacked a sufficient number of digits to measure the levels of atmospheric pollution in Delhi paint a dismal picture of a city under siege.1 Similarly, the images of American cyclists arriving in Beijing for the 2008 Olympics wearing masks has come to symbolise China struggle against atmospheric pollution.2
These narratives capture the environmental dilemmas faced by developing countries: A population, currently under siege from forces unleashed by industrialisation, hoping that the same forces of industrialisation may leads to rising living standards in the foreseeable future and may turn out to be their salvation.
Simon Kuznet’s captured this tug of war between the ugly present and a hopeful future in his now fabled Kuznet’s curve. The conjecture in Kuznet’s curve was that as poor countries developed, the income inequality increased initially before it starting to decline. That is, inequality somehow started the engines of growth in a poor country and played a part in raising living standards. Put another way, inequality was the price to pay for development.
Analogously, Environmental Kuznet’s curve is a hypothesis as the economic activity in a poor country picks up, the environmental pollution initially gets worse before it starts getting better. We sift through some of the empirical evidence on Environmental Kuznet’s curve below to see whether the data supports this claim.
Emissions per-capita
Almost all human activity produces some form of environmental pollution is a by product. As the country produces more goods and services, it leads to prosperity, but also produces environmental pollution concomitantly. Pollution beyond a certain point has a way of making its presence felt and people living in the country experience its harmful effect.
One way to examine the proposition whether the atmospheric pollution “gets worse before it gets better” is to examine what happens to the emissions per-capita as the per-capita income of the country increases.
Let’s examine the pattern of pm25 emissions using a dataset that spans from 1970 to 2012. pm25 is atmospheric fine particulate matter with a diameter of less than 2.5 and 10 micrometers and has extremely adverse consequence for the health of the people who breathe it. The two main sources of pm25 are biological sources and fossil fuels sources.
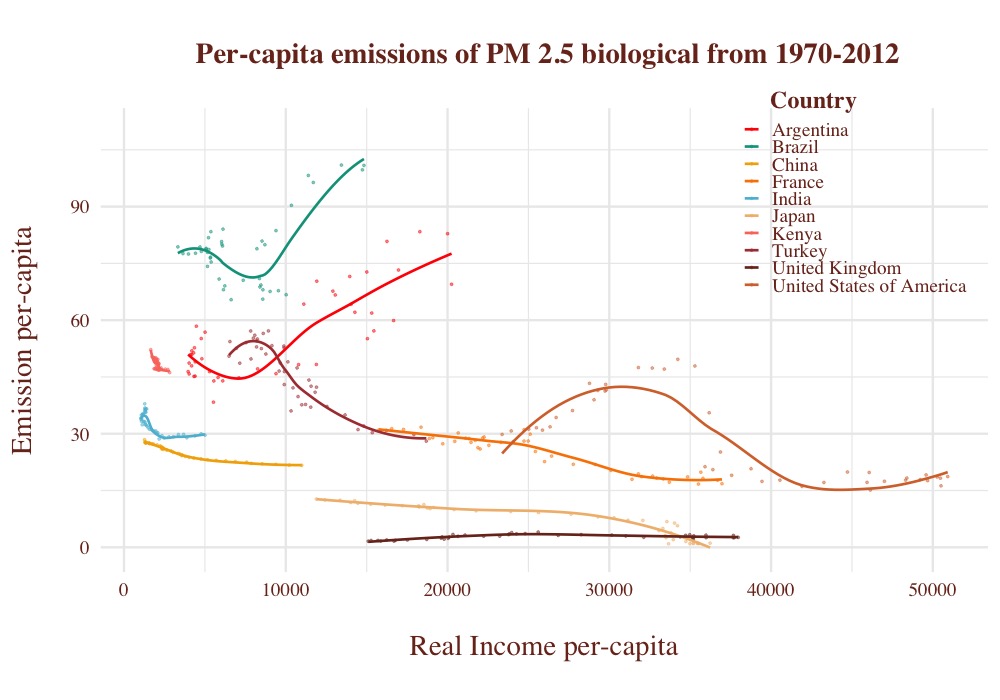
The figures below plots the per-capita pm25 emissions from biological sources against per-capita income for a range of countries. It appears that as poor countries gets richer in terms of per-capita, pm25 biological emissions increases but it decreases as relatively better-off countries get richer.
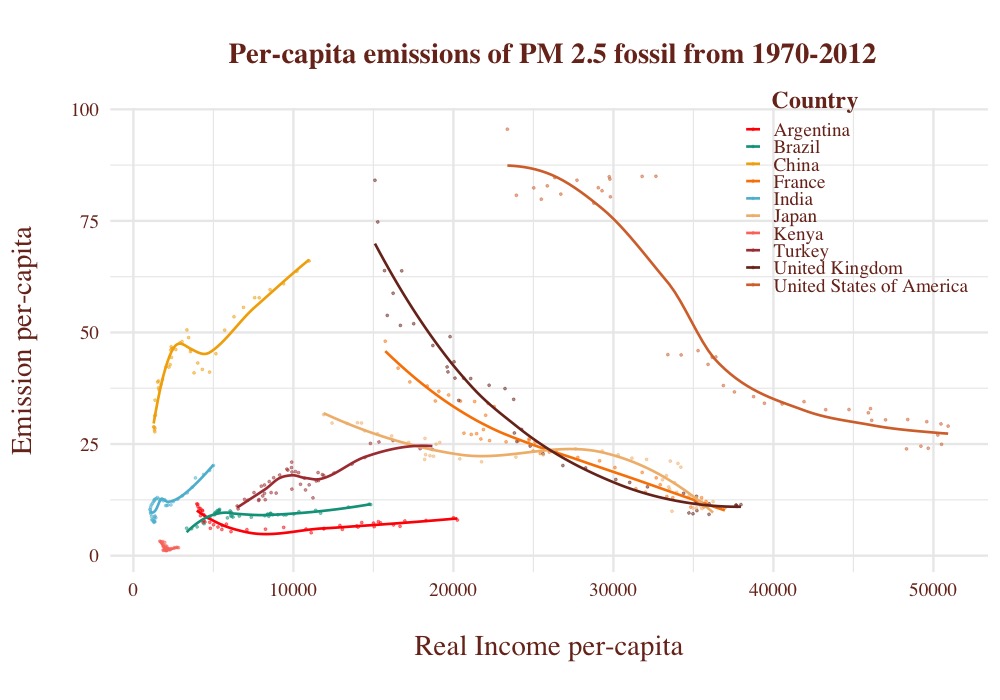
There is a similar pattern with per-capita pm25 emissions from fossil sources. The emissions per-capita increases as poor countries get richer and decreases when relatively better-off countries get richer.
Emission intensity
Since emissions are a by product of economic activity, the natural question is what happens to the emissions per unit of economic activity as a country gets richer. This is known as emission intensity and is calculated simply by dividing the total emissions by the real GDP of the economy.
Emission intensity reflects captures the average emission per unit of output produced in the country. The only way the production process can get cleaner is if either the producers bears the cost of abatement or just adopt a new cleaner technology. As the population of the country gets richer, they force the producers to bear the cost of abatement or there is social and technological innovation that makes the production process cleaner.
The figures below examine below what has happened to emission intensity of pm25 from biological and fossil fuel sources in range of countries across the world. The emission intensity of pm25 from both biological and fossil fuel sources decline quite significantly as poor countries with per-capita income below USD 10,000 get richer.
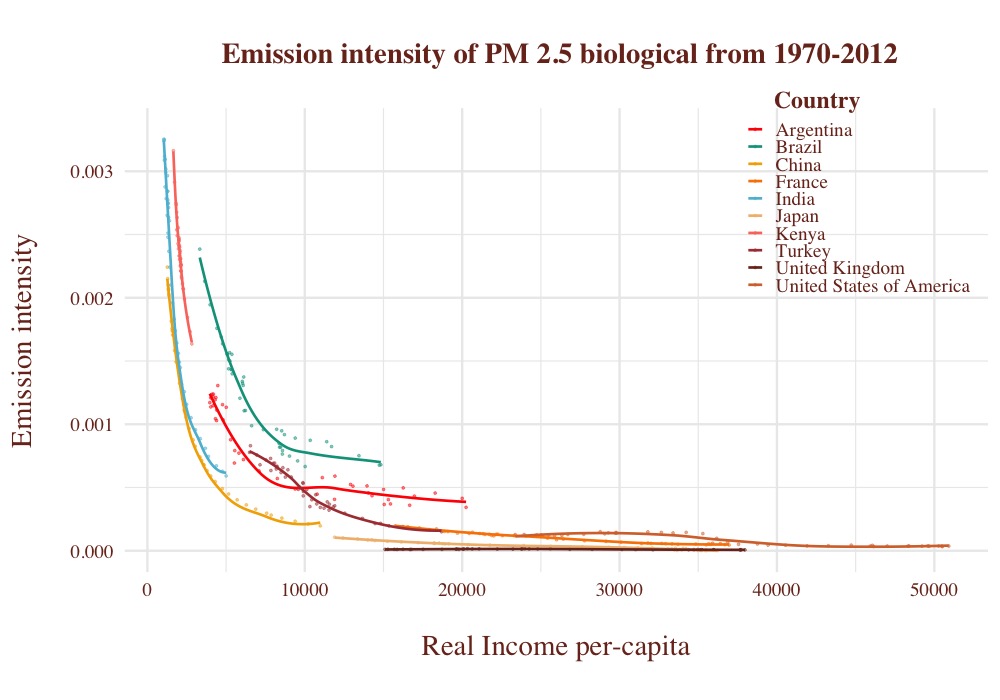

Yet, the emission of pm25 per-capita was increasing in these very countries. The natural question is why does the emission per-capita increase in even though the emission intensity is declining really fast with per-capita income. The answer lies in the relationship between per-capita emissions and emission intensity. The relationship can be written in the following way.
$$ \text{Emissions per capita} = \text{Emissions intensity} \times \text{Income per capita} $$
We have obtained this relationship by simply dividing and multiply the right hand side by real GDP.
$$ \frac{\text{Emission}}{\text{Population}}=\frac{\text{Emissions}}{\text{Real GDP}}\times\frac{\text{Real GDP}}{\text{Population}} $$
In poor countries, emission per capita can increase even if emission intensity is decreasing over time. This happens if the GDP per-capita is growing at a faster rate than the rate of decline of emission intensity. This means that fast growing countries can live through a period where emissions per-capita is increasing even through emission intensity is decreasing, albeit at a slower rate than the rate at which GDP per-capita is growing. For emissions per-capita to decrease, the emission intensity would have to decrease at a faster rate than the increase in GDP per capita.
Countries go through all kinds of changes as they transition from being a poor to middle income country. Economic growth may come before new technology. Similarly, formal institutions that regulate the environment and put pressure on the producers to abate the pollution may take time to mature and be effective.
The light at the end of the tunnel is that environment does gets cleaner eventually as countries get richer. Yet, the transition could last decades and a huge human cost is borne by the generation of people who live through the transition. Some countries like South Korea and Singapore have transitioned from being a poor to a rich countries. Other countries like Argentina and Brazil seem to have got stuck at the middle income stage where the emission per capita is still increasing over time.
Header image by roegger from Pixabay
